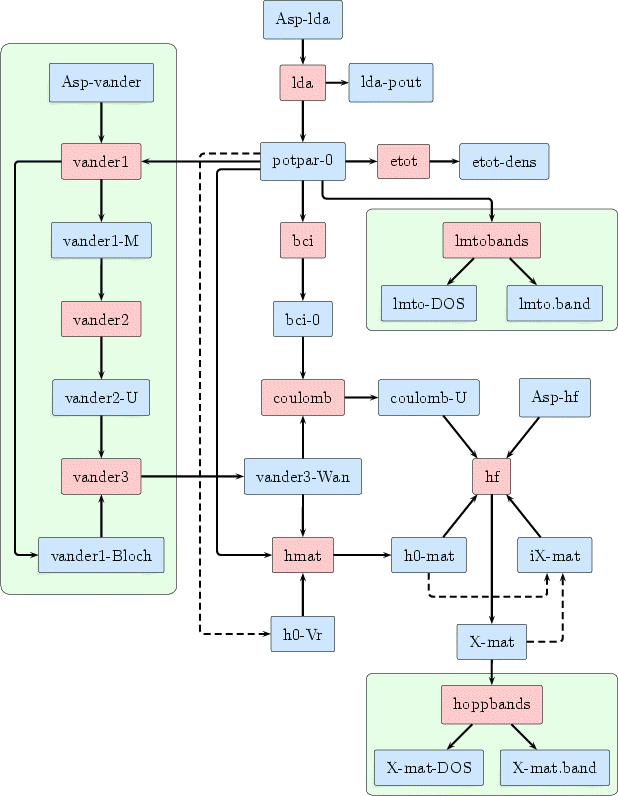
Computational flow diagram

This computational flow diagram shows how I arrived at the results presented in my doctoral thesis. It gives you an idea how programs (red) interact with data (blue), i.e. how data are produced by the programs and how these data are used by further programs. Unfortunately, it would go beyond the scope of this modest web site to present the C++ programs together with a manual describing how to operate them.